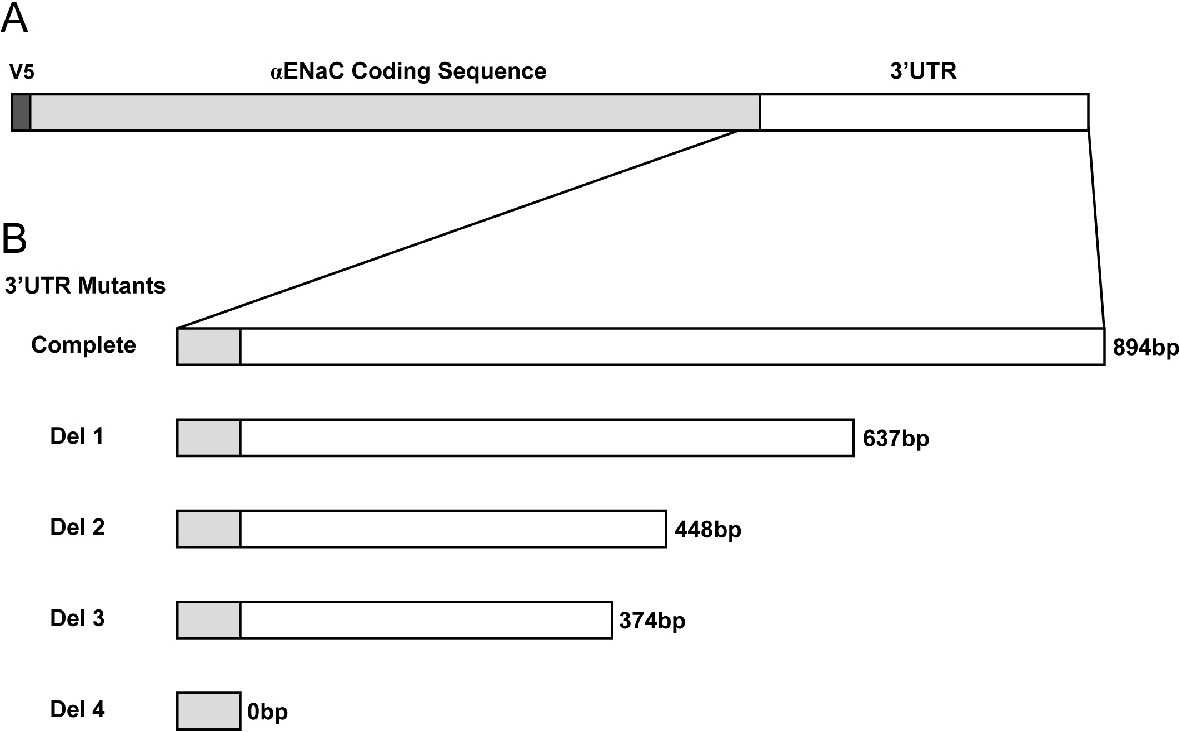
Fig. 2. Map of the αENaC 3'UTR deletion mutants. (A) Schematic map of the V5-αENaC transcript with the complete 3'UTR inserted in the pTRE-tight expression vector. The open reading frame is depicted as a gray box while the 3'UTR is shown as a white box. (B) The 3'UTR portion of αENaC mRNA is depicted for the clone bearing a complete 3'UTR and for the different deletion mutants (Del 1 to Del 4).